
Broadcast Monitor · Audio
From a quiet presenter to a loud music cue, keep useful audio measurements beside the picture.
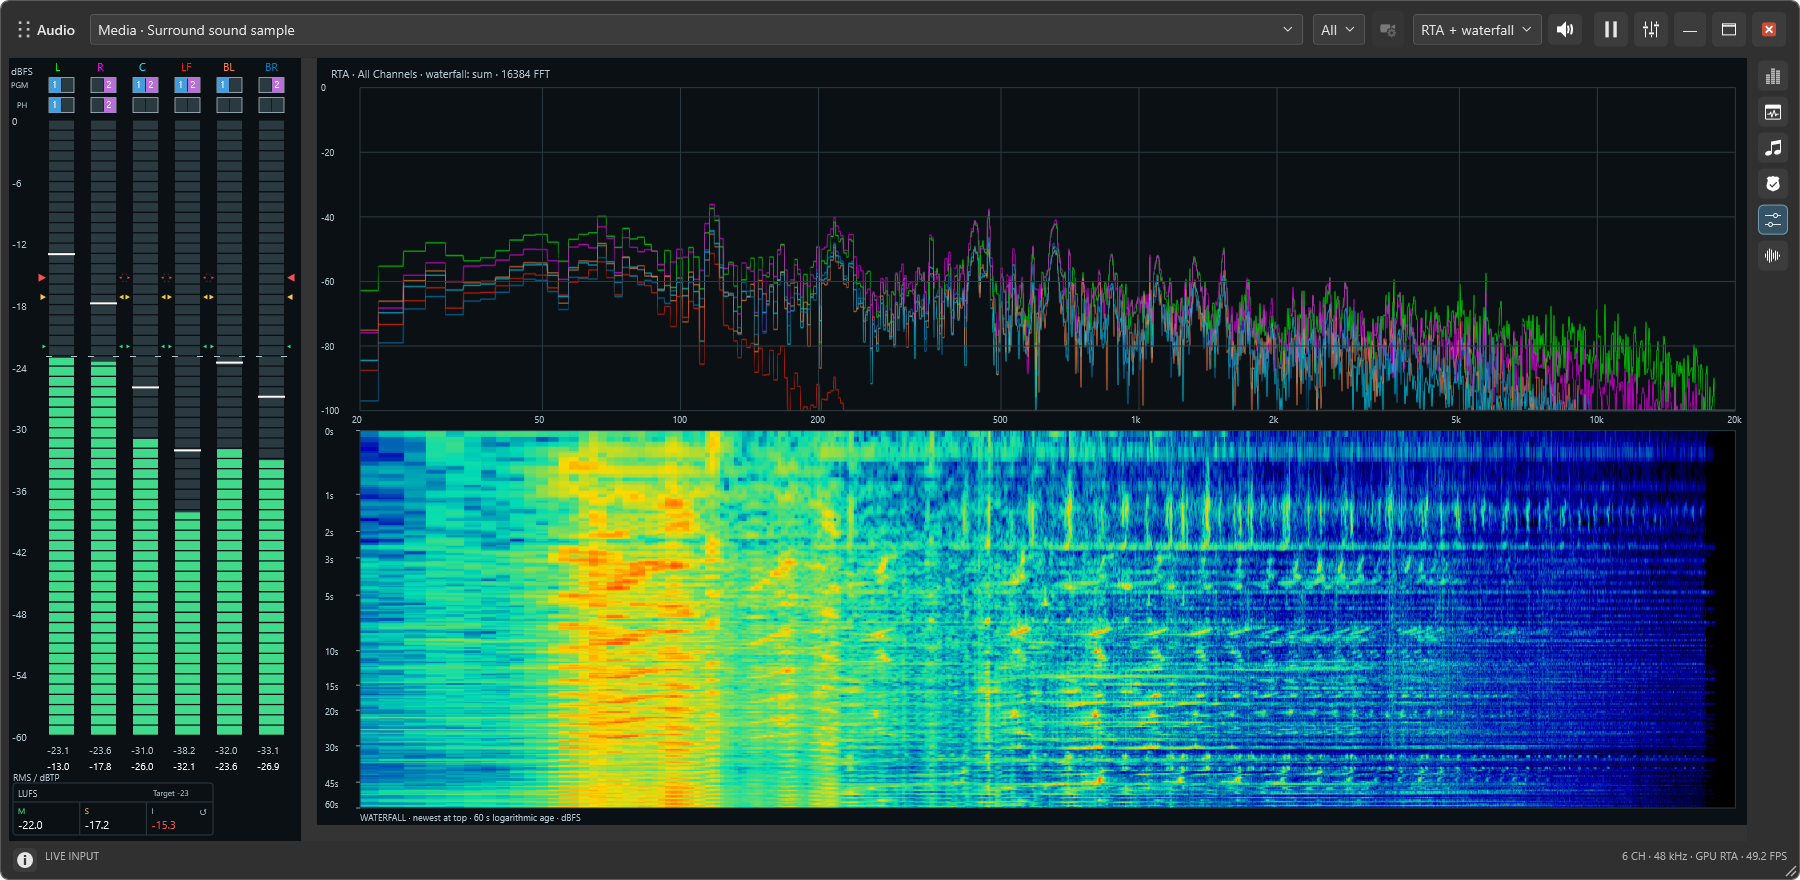
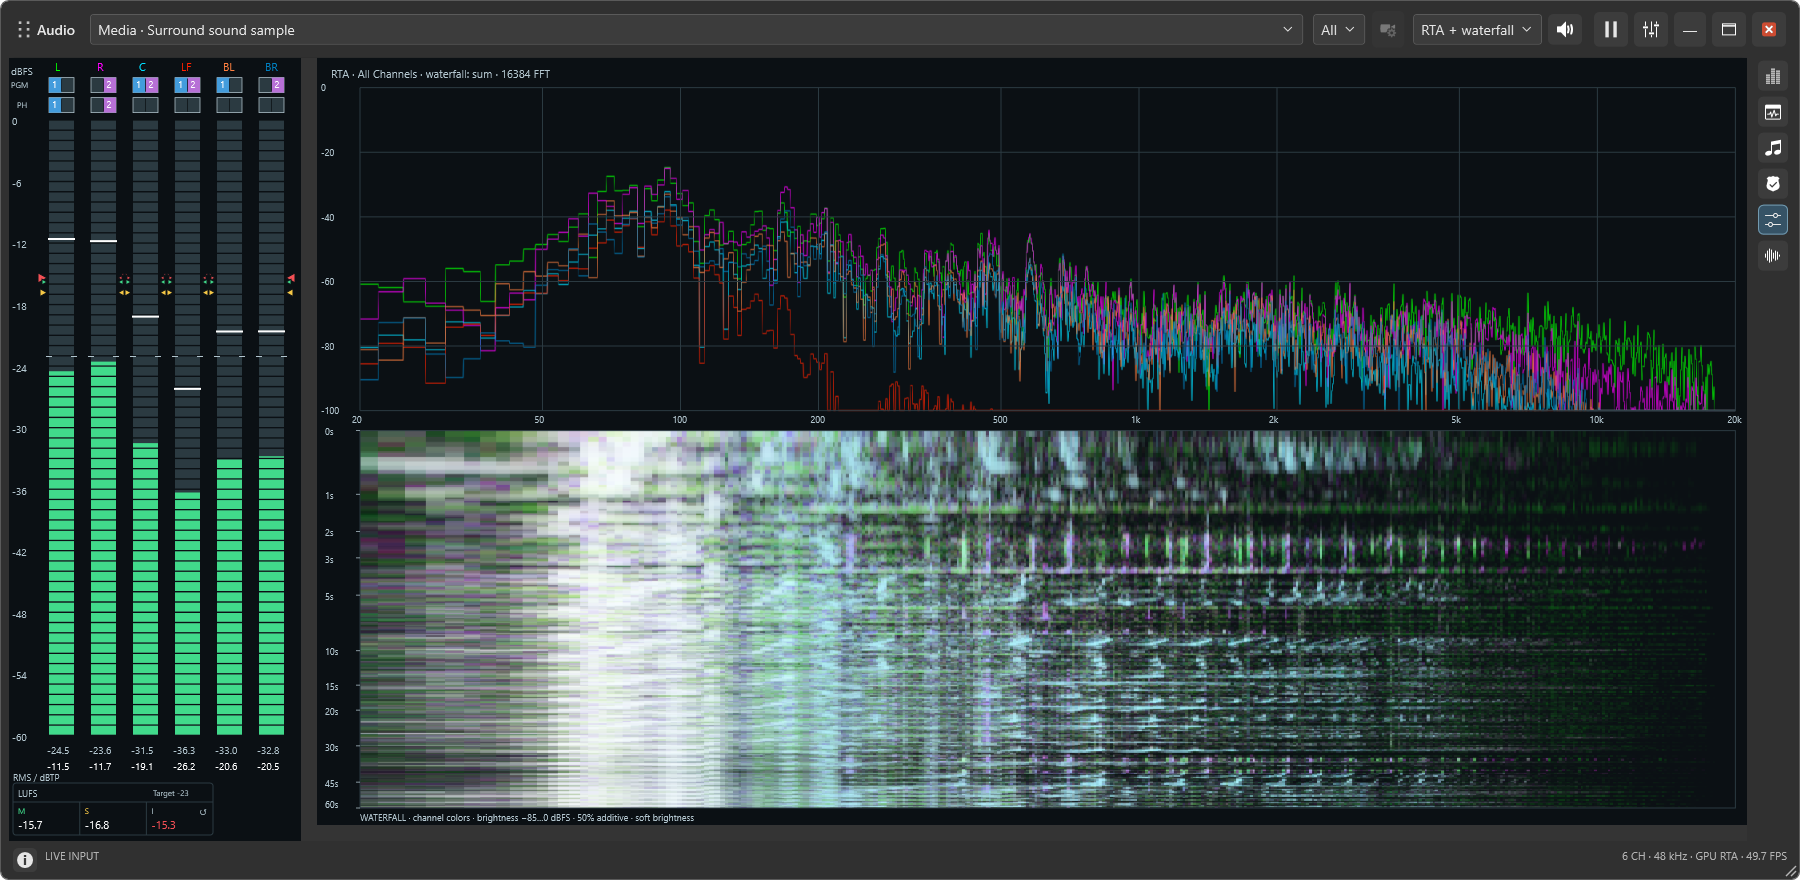
Professional offers a signal heatmap for energy over time and a Multi-channel waterfall for channel contributions. These views show the same six-channel sample after a full minute of waterfall history has built.
Express and Professional let you route source channels into a stereo listening mix independently of the channels used for phase analysis. Enable Listen to hear that mix through the default Windows playback device. Routing changes take effect without reopening the device, so you can investigate a channel while keeping your monitoring session running.
Loudness readings add momentary, short-term, and integrated measurements to the channel-level displays. They help you compare brief changes with the average loudness over longer periods. Professional also adds spectrum and waterfall analysis, plus audio-only file playback for reviewing music, voiceovers, and cues. When sources report speaker roles, channel labels identify positions such as left, right, center, and LFE; unspecified channels remain numbered.
See whether audio is present and how close it gets to the top of the available range. Compare a quiet speaker with a loud musical cue and leave room for unexpected peaks.
Included in Express and Professional.
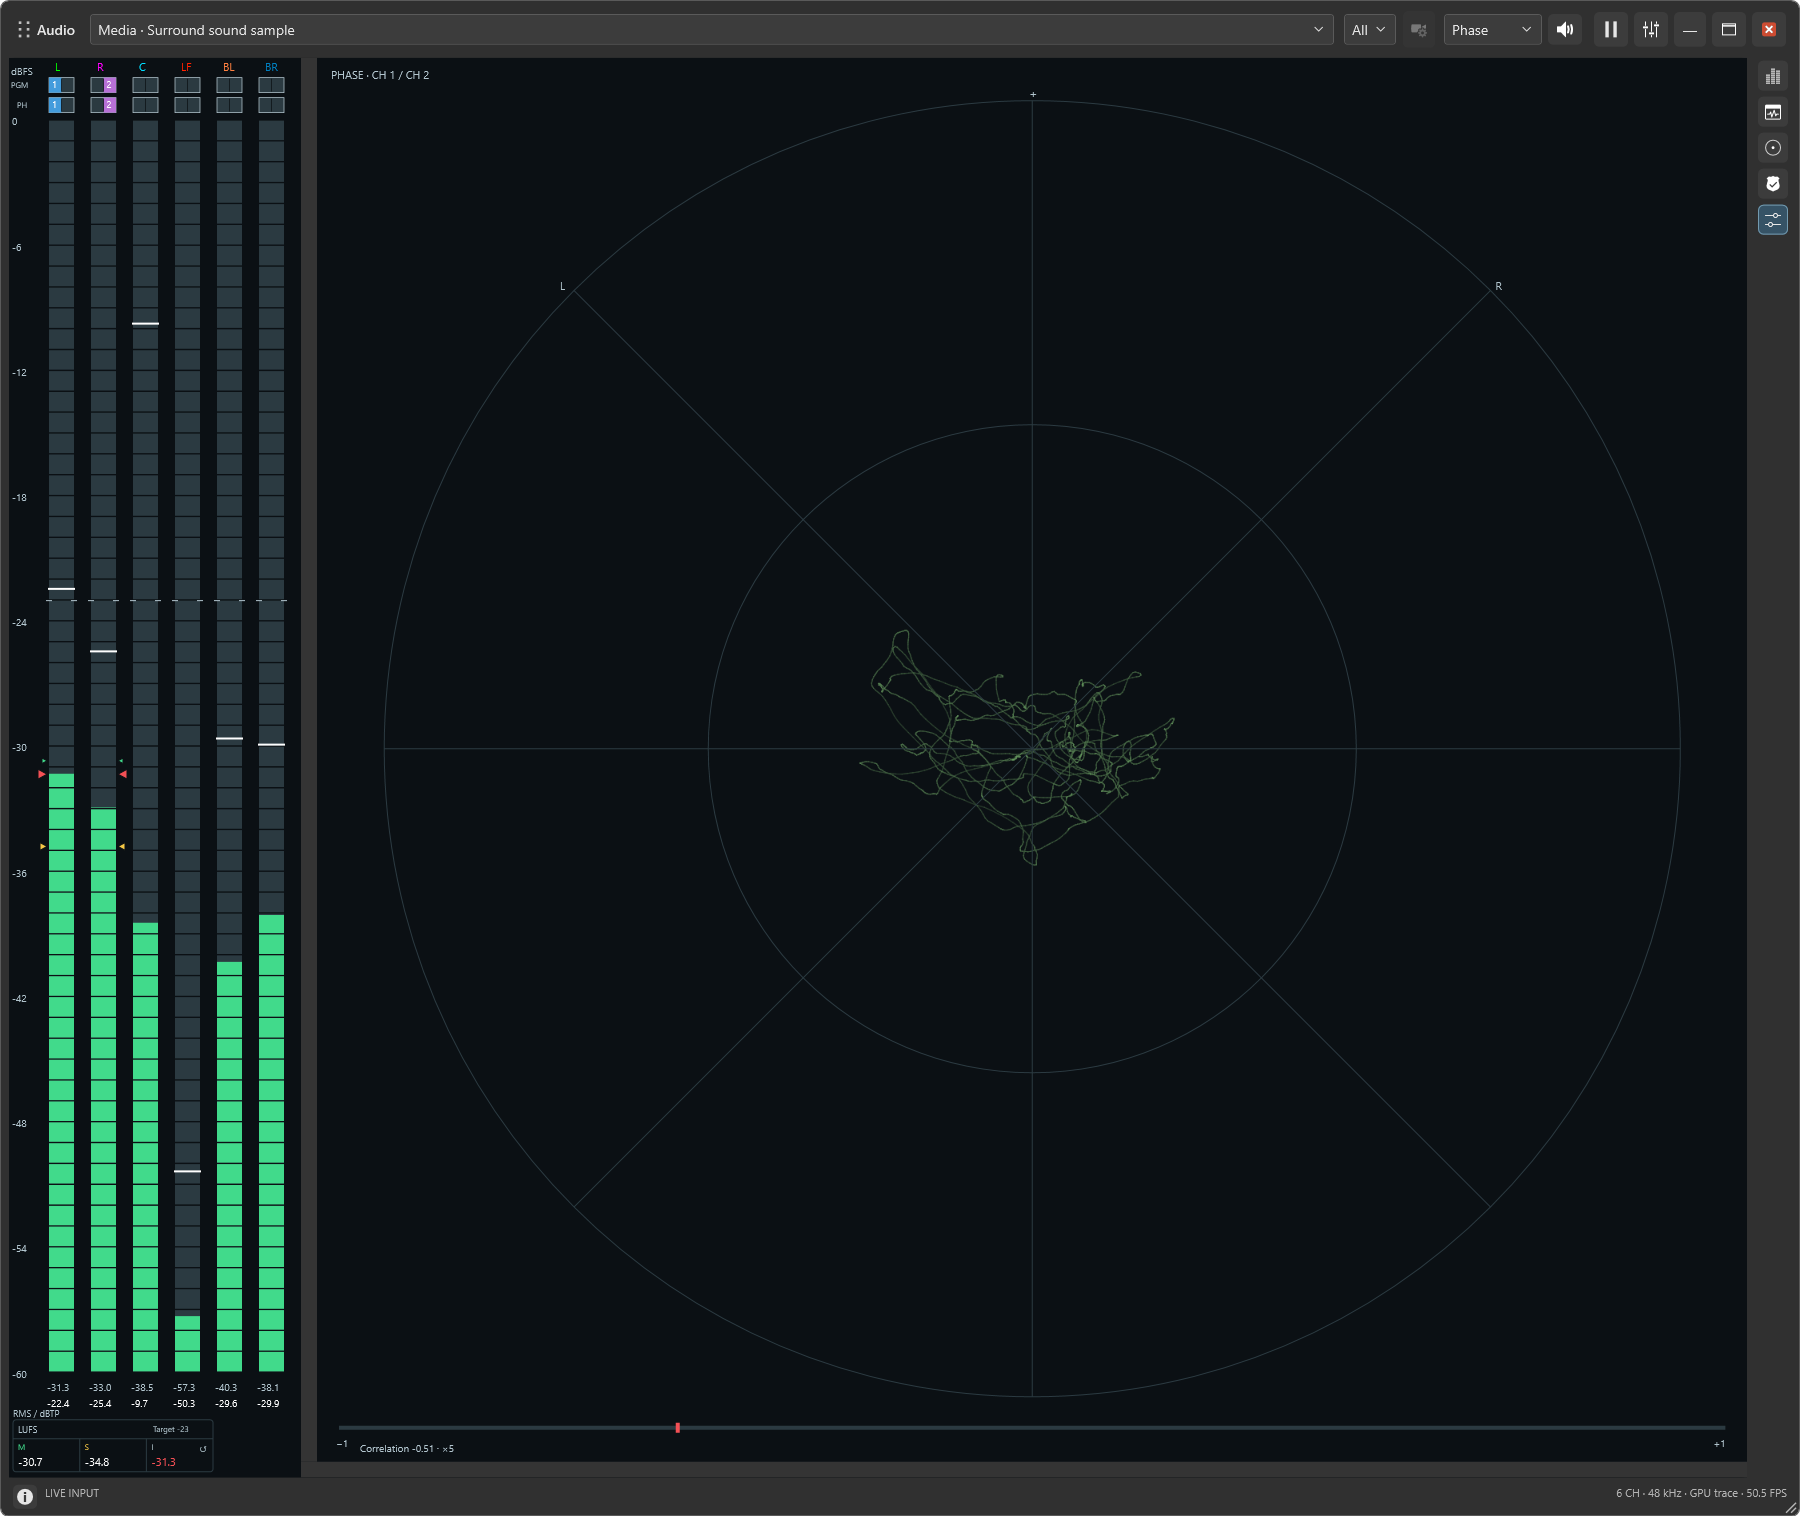
Inspect the relationship between the left and right channels. Unusual phase behavior can prompt a mono listening check, where some material may weaken or cancel.
Included in Express and Professional. Always listen as well as watch.
See each source channel's changing amplitude across a rolling 20 ms window, independently of your listening mix. Compare channel activity and inspect waveform shape when meters alone do not explain what you hear.
Included in Express and Professional. This is a rolling display without trigger stabilization.
Keep up to five minutes of channel levels and momentary, short-term, and integrated loudness in view. The latest 30 seconds have the most space; older history is compressed into the left side of the graph.
Included in Express and Professional. Look back at a quiet introduction or a loud cue to understand a change you just heard. Display suspension leaves gaps in history.
See how audio energy is distributed across frequencies. It can help you investigate a low-frequency rumble or a persistent tonal sound and give you a clearer direction for further listening.
Included in Professional.
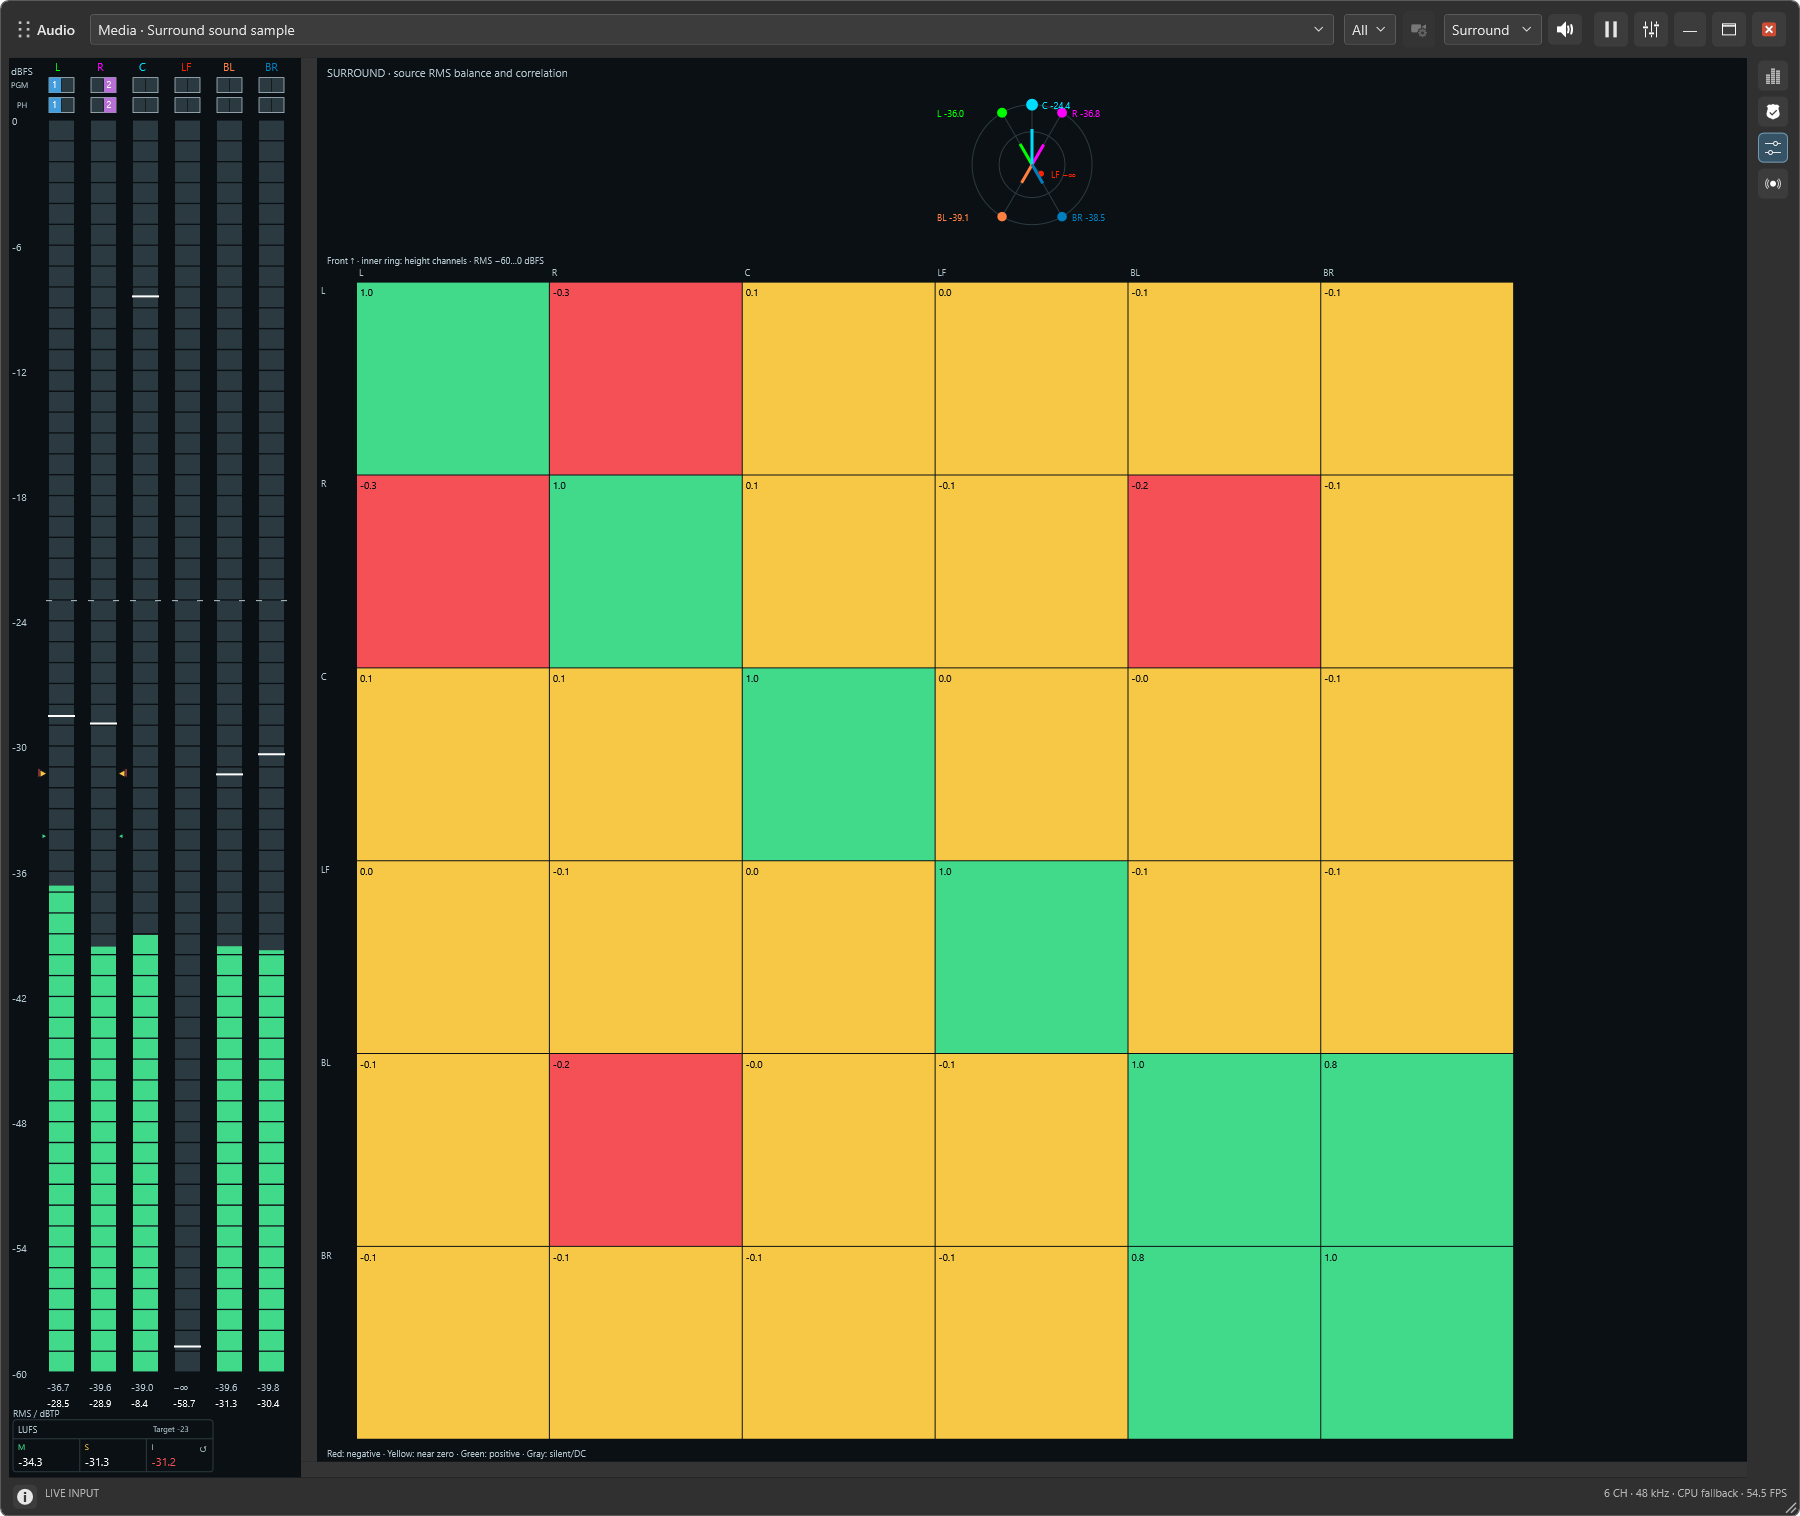
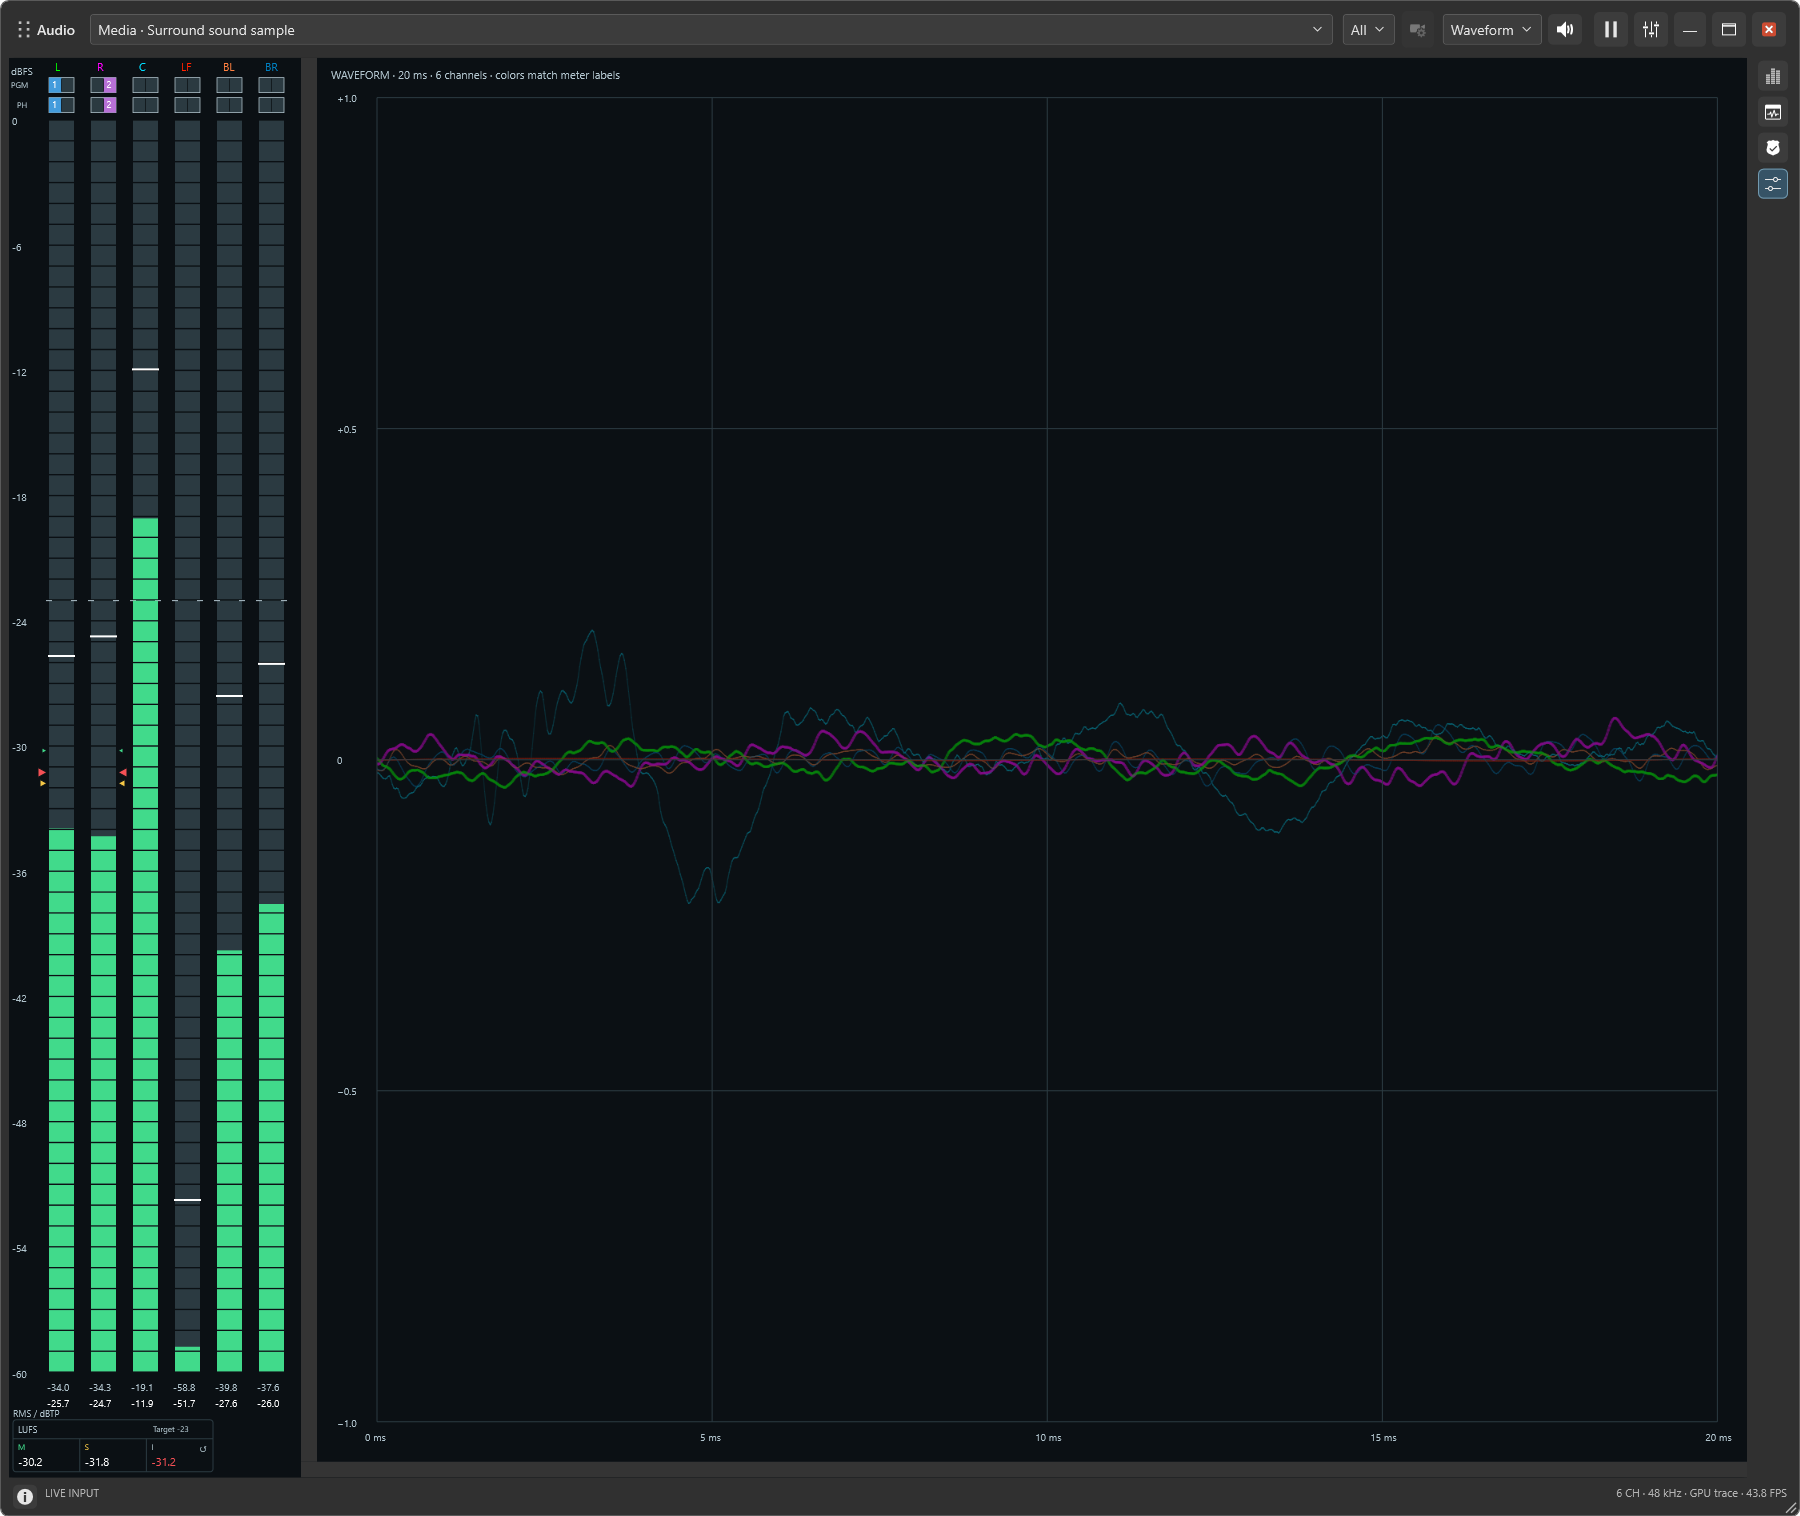
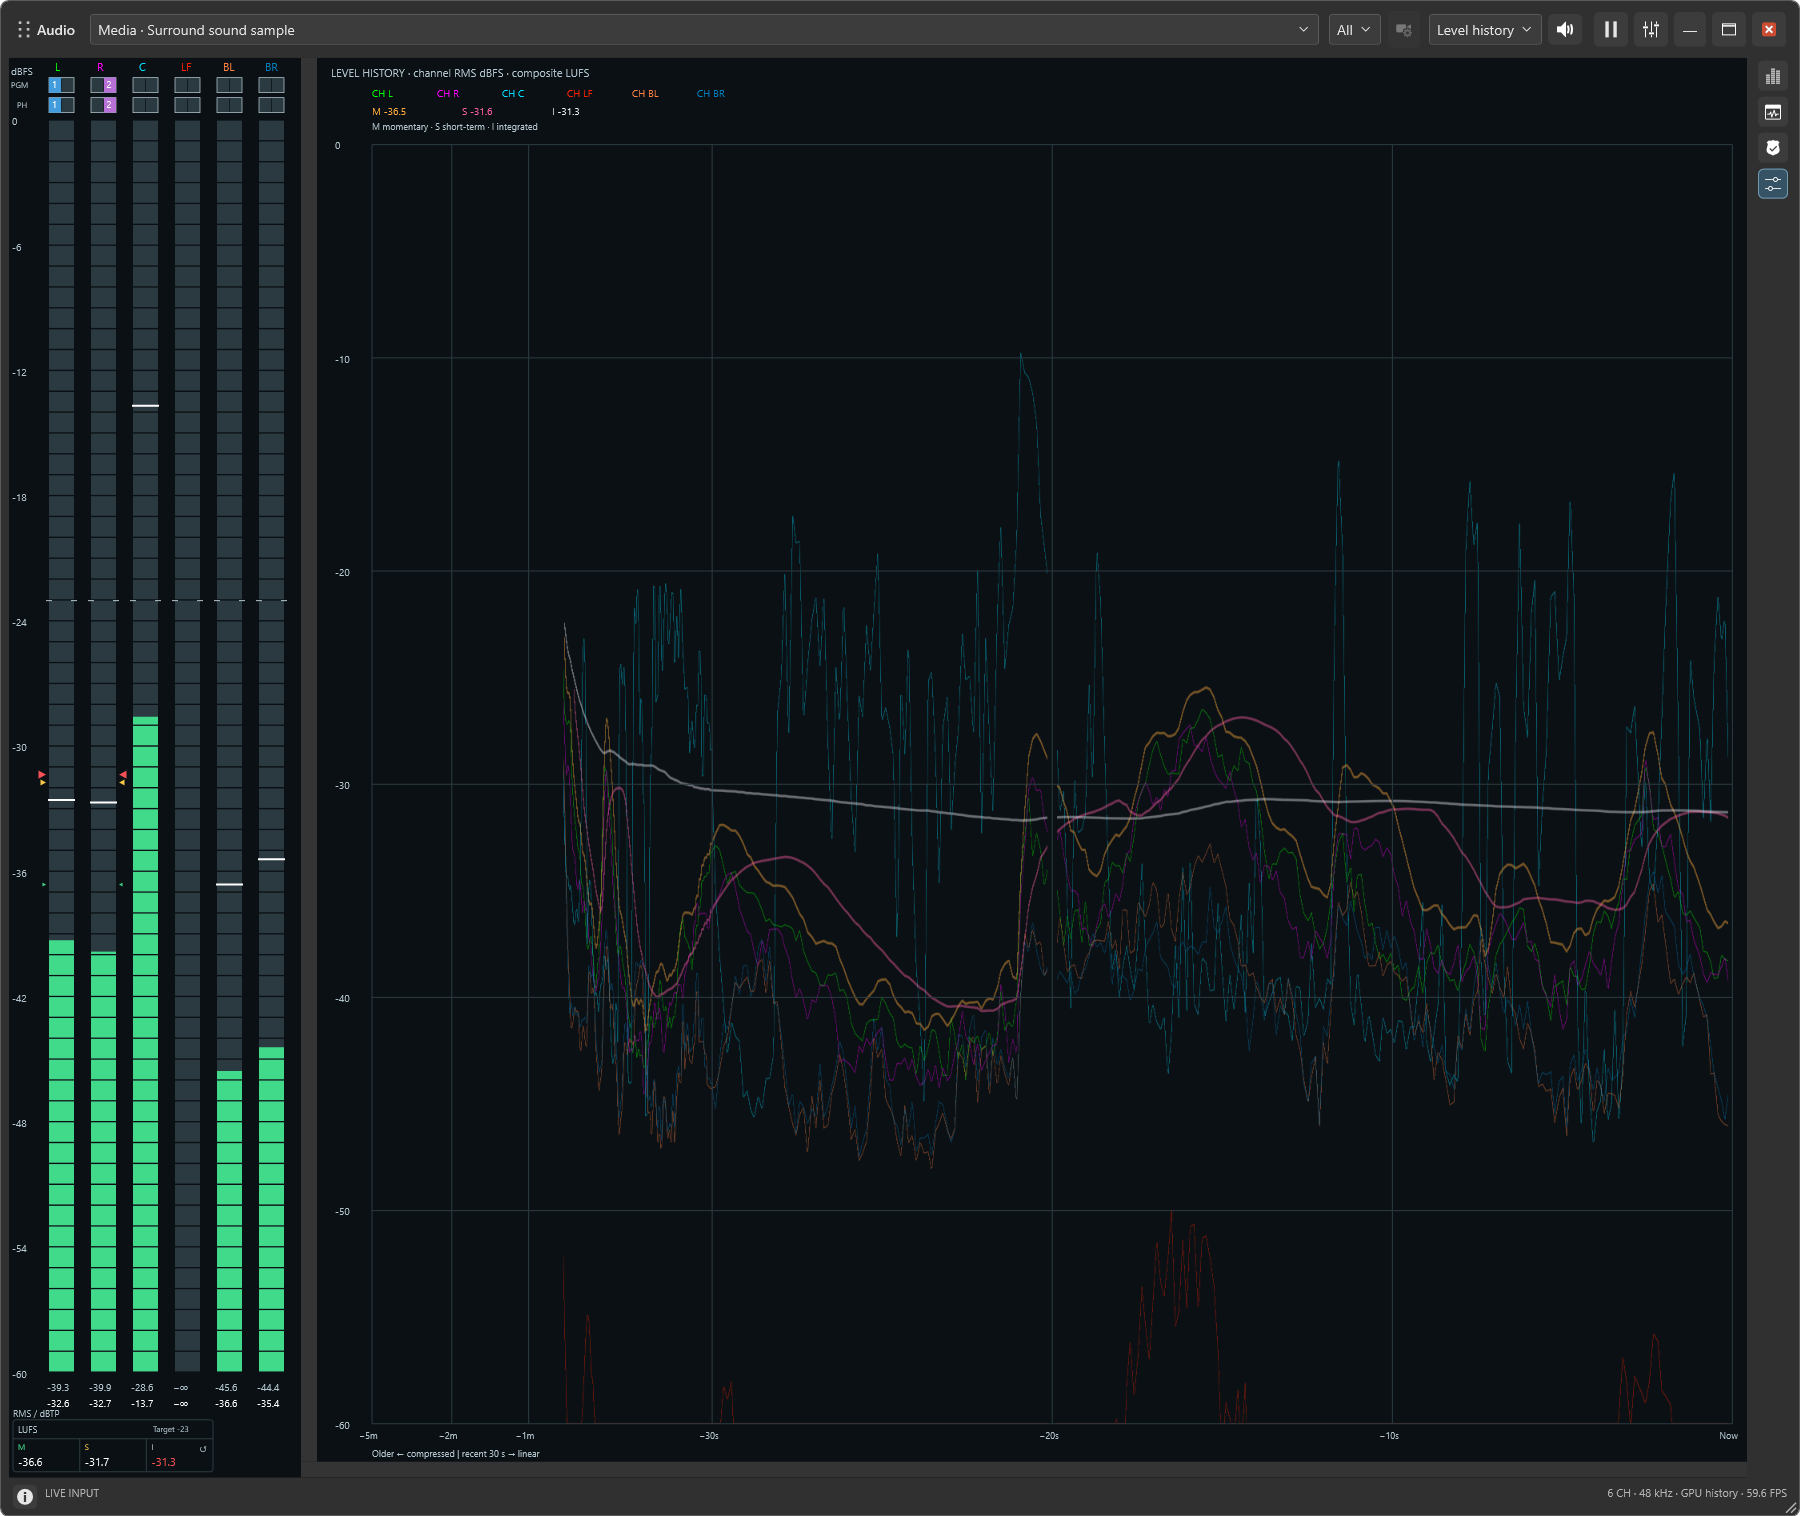
Professional adds all-channel spectrum traces, multichannel waterfall displays, and Surround analysis. Loudness can be shown per channel with configurable LUFS/LKFS targets. Optional audio-quality cards help investigate clipping, headroom, hum, and quiet-level evidence; these are descriptive guides, so verify concerns by listening.
Supported panes can select audio independently of video. Keep a sample photograph or camera in view while measuring a standalone audio input, an attached source, or Professional audio-file playback.
Focus the Audio pane, then use Alt+1–9 to select an available toolbar display in order. Express offers Phase, Waveform, and Level history; Professional also includes RTA + waterfall and Surround. The order therefore depends on your edition.
Hold numpad 1–9 to magnify a region of the graph while keeping channel meters visible. Release to restore your view. Over the graph, Alt+wheel cycles displays; in Phase, the wheel changes magnification, Shift+wheel adjusts intensity, and Ctrl+Shift+wheel adjusts persistence. Ctrl+wheel adjusts trace width in supported modes.
Use Ctrl+Tab to move to the next pane. See the shared inspection shortcuts.
Continue the tour, or choose any topic from the navigation above.